The problem
Leadership wanted exec-ready views across marketing, merchandising, and product. Enterprise BI meant licenses, a platform queue, and charts that never matched the deck. Notebooks meant nothing a VP could open on a phone at 7 a.m. And every one of these views ends up screenshotted into a deck or a Slack thread, where a sloppy table reads as a wrong number even when it's right.
The build
- Each dashboard is a Python generator that emits one self-contained HTML file. Data embedded, all interactivity client-side. Publishing is copying a file. No BI licenses, no server.
- A generated hub with a staleness dot per tile, refreshed by 36 scheduled jobs.
- A written design standard. Value and delta columns always adjacent. Rate changes in basis points, colored by direction-of-good. One blue for the focus period, one orange for the baseline, everywhere.
- A footing rule. Money rows must match the attribution source of truth to the dollar. People add reports together; a bridge that reads lower is dead on arrival.
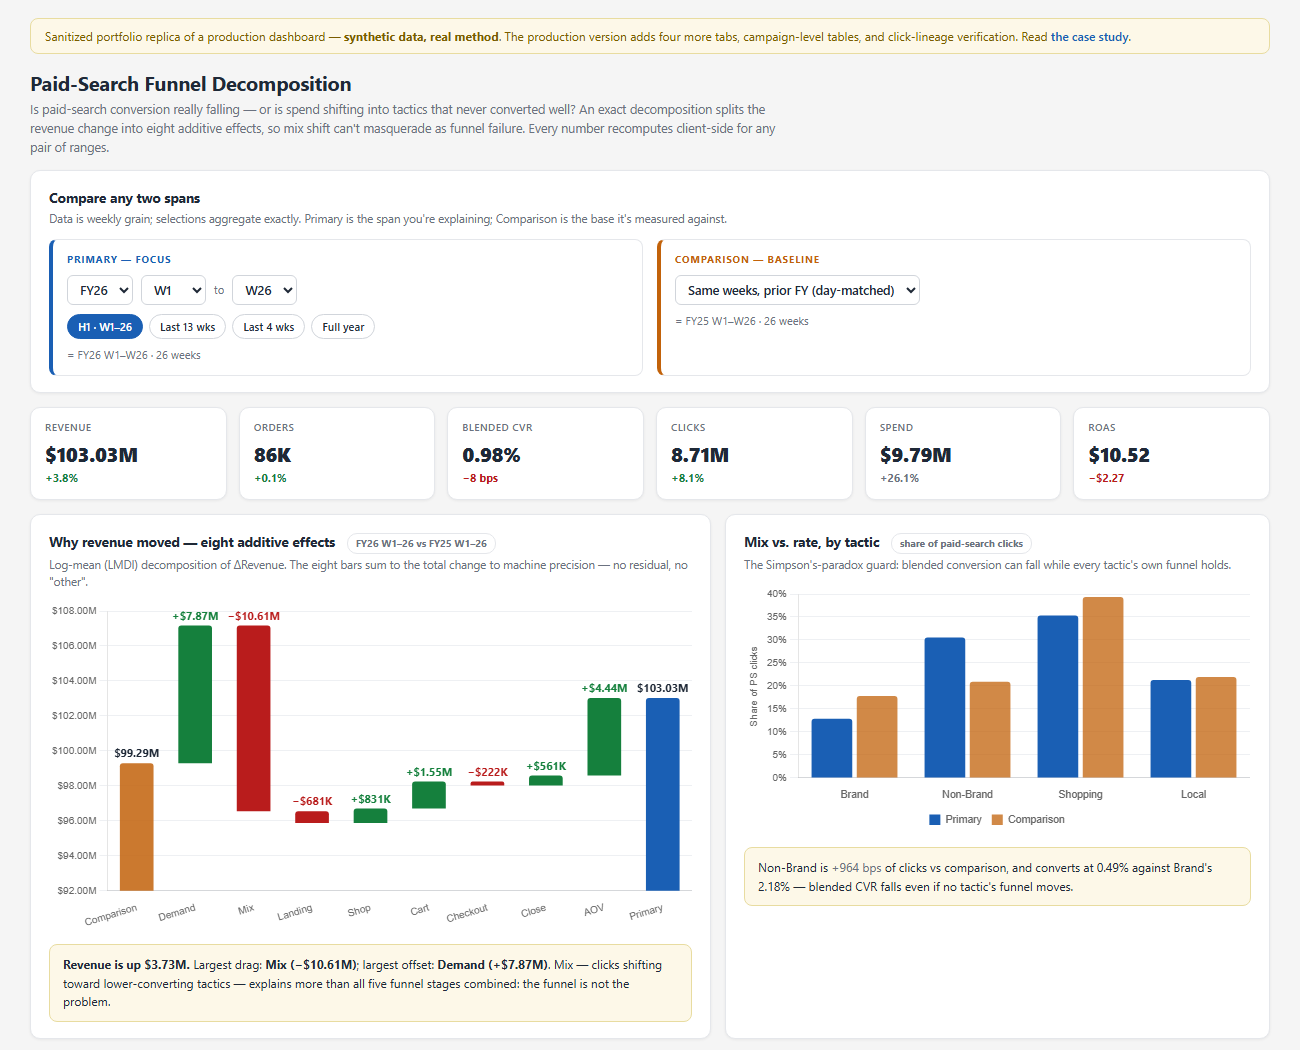
- The flagship: a paid-search funnel decomposition that splits any revenue change into eight additive effects summing exactly to the total, so a spend shift into low-converting tactics cannot masquerade as a broken funnel. Replica below: real interface, synthetic data.
What it showed
The week it paid for itself: brand paid-search clicks fell 25%. The room's reflex was "we lost position to a competitor, raise bids." The auction panel said 96% impression share and 0% lost to budget, in both years. The decline was not buyable. Eligible searches were down and click-through was eroding. A six-figure "allocation loss" was reclassified from a budget lever to a demand signal, and the bid increase never happened.
It polices itself, too. One week a view mixed a complete seven-day total with a six-day slice from a stale cache, and a funnel rate dropped about 1,000 basis points across all four tactics at once. Real click-quality shifts are tactic-specific, so that pattern is now written doctrine: denominator artifact, not a real move. When a dead tag made add-to-cart read 726%, the fix was a generic impossibility gate (more adders than viewers) that blanks the metric, shades the band, and self-heals when the backfill lands.
What changed
- The hub is the operating cadence. Stakeholders open dashboards instead of requesting pulls.
- Dashboards get retired when a better cut supersedes them. Curated, not accreted.
- The Wednesday deck runs as one command: detect the fiscal week, run eleven modules against the mart, screenshot each view into deck-ready images. A mid-week correction is a re-run, not a rebuild.
- A retail leader's question from a business review got its own permanently maintained tab.
Technical notes, for the people who will ask
Decomposition. Log-mean Divisia (LMDI-I) over the identity Revenue = Σtactic Clicks · share · (Sess/Click) · (Shop/Sess) · (Cart/Shop) · (CO/Cart) · (Orders/CO) · AOV: eight effects, additive, zero residual. The engine is a generic N-factor chain with unit tests, reused across three dashboards; the Python and client-side JS implementations are cross-checked on every generation.
Verified click lineage. The production bridge anchors paid clicks to sessions via click-ID matching (~85–90% coverage), so "clicks that never produced a measured visit" is a real, sized bar instead of a shrug.
A method rejected on sign. An earlier spend-mix valuation (Laspeyres-style, crediting added spend at last year's return) flipped the sign of a reallocation effect, because it valued new dollars at a rate measured on almost no spend. Replaced with an exact identity valuing dollars at their realized return.
Delivery. Single-file HTML with embedded data caches; daily-grain data so arbitrary ranges aggregate exactly; per-table CSV export that opens clean in Excel; scheduled refresh via ~36 OS-level jobs; the deck renderer drives headless Chrome for pixel-identical screenshots.
The other two case studies: the semantic layer underneath all of this and the organic-decline decomposition, or back to all work.