Bret Lawson
I find the answer the headline number is hiding.
Analytics and measurement leader, twenty years in ecommerce and omnichannel retail. I build the data layer, do the analysis, and ship the reporting, end to end, so leadership plans against numbers that hold up in the room.

Selected work
Four case studies from the last year: the data layer, the deepest analysis that ran on it, the delivery layer that carries answers into the weekly cadence, and the brand-search analysis that stopped a budget increase that could not have worked. Chart shapes are real; scales are disguised. And one model you can drive yourself, on synthetic data.
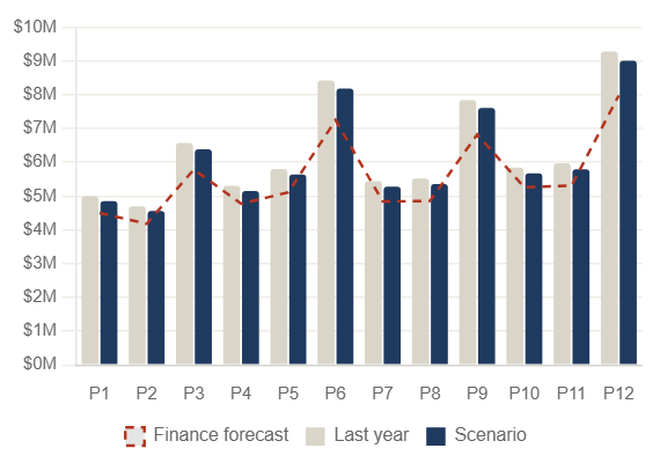
Planning scenarios: what next year's plan buys
Spend by channel in; sessions, conversion, AOV, and sales by period out. Per-channel response curves, a brand ceiling, halo and cannibalization on or off.
Organic search traffic fell by a quarter. Rankings explained under 1% of it.
Seven measured causes that add up exactly to the loss. Store listings and lower category demand did most of the damage, AI Overviews took a fifth, and blue-link rank, the thing the org was organized around, was 0.7%. The head term held #1 the whole time.
One data mart replaced eight source systems and reconciles to finance to the dollar.
One row per day, 136 documented metrics, refreshed every morning, read by 40 downstream projects. Ecommerce sales match finance to the dollar. It also caught three broken feeds before they reached a deck.
The BI stack is a folder of HTML files.
Fifteen-plus dashboards and a one-command weekly deck, generated by Python and footed to the dollar. Includes a working interactive replica of the flagship: an eight-effect funnel decomposition that stopped a confident wrong bid increase.
Spending more on our best-ROAS channel would have bought nothing.
Impression share was already 96%. Click elasticity to bid: +0.08, statistically zero. Even at 100% share on every campaign, clicks would still trail last year. Over 80% of the drop was one campaign someone switched off. The money went to channels with headroom.
- Online-to-offline attribution·web-only said 0.9 ROAS, stitched store sales said 4.0, channel holdouts said 2.4; budgets run on the last number.
- Sales-floor behavior analytics·the close-rate leaderboard was ranking tool adoption, not closing skill; three honest denominators split coaching into the right conversations.
- SKU sales decomposition·splits sales swings into launches, exits, and true like-for-like movement, and auto-flags SKUs whose conversion is quietly collapsing.
- Purchase-propensity signals·per-channel models for on-site personalization, including the feature that turned out to be 90% data leakage, caught before deployment.
About
I'm an analytics and measurement leader with twenty years in ecommerce and retail. I spent a decade building and running my own ecommerce company before moving into enterprise analytics, which is why I think in P&L terms first and dashboards second.
At a nine-figure national retailer I built the ecommerce analytics practice from the ground up: the warehouse modeling, the forecasts leadership plans against, and the attribution that ties marketing spend to real store revenue. I work the whole stack, from the data model to the number on the slide.
What I do best is take data nobody else can connect and turn it into an interactive view that answers the question on the table, and the one no one had thought to ask yet. Lately that runs through an agentic-AI workflow that compresses weeks of analysis into days. The thing I care about most is whether an answer survives the follow-up question in the room.
Experience
- Built the ecommerce analytics practice from zero for a nine-figure business: a dbt semantic layer on BigQuery unifying ERP, ecommerce, marketing, and behavioral data into a governed single source of truth.
- Designed and shipped executive dashboards in Streamlit, R Shiny, Looker Studio, and custom HTML, built for adoption rather than just delivery.
- Delivered revenue and KPI forecasts at ±5% accuracy used for budget allocation, plus a CPC-based paid-search traffic engine and spend-scenario models for annual planning.
- Architected online-to-offline attribution linking digital marketing spend to in-store transactions, complementing media-mix modeling with transaction-level precision.
- Integrated Claude Code and MCP data connectors into the analytics workflow, cutting build time roughly 68% while keeping analysis auditable.
- Led omnichannel analytics for an 800+ location national retailer; promoted from Digital Analytics Manager in 2019.
- Built cross-channel attribution integrating online and offline touchpoints to guide budget allocation and reduce customer acquisition cost.
- Deployed an Adobe Advertising DSP framework with geospatial targeting, delivering a 30%+ improvement in campaign efficiency.
- Established the KPI framework connecting web analytics to store foot traffic for executive visibility.
- Launched a 400,000+ SKU ecommerce platform in 14 months, hitting top-of-industry conversion benchmarks.
- Led cross-functional teams of 20+ across development, merchandising, and operations; integrated catalog, inventory, and payment systems.
- Built a specialty ecommerce retailer to $2M+ revenue and #3 nationally in its category.
- Personally engineered a 100% automated order, fulfillment, and reporting system end-to-end, and applied early analytics to pricing, acquisition, and inventory.
Skills & stack
Tools are table stakes, so this is kept brief on purpose.
Available for senior analytics leadership roles.
If you're building an analytics function that has to turn data into decisions leadership trusts, that's the work I do best. Bring me the messy, multi-source problem nobody's been able to answer.